Product: Awair Omni
Note: Awair Business Dashboard is only compatible with Awair Business App and must be activated internally before you can access it. If you’re interested in setting up an Awair Business account with us, please click here to get in touch with our sales team.
Overview
This article provides and overview on how to view and export/download your sensor data from the dashboard. It also provides a stepwise guide on how to view your weekly reports.
Process
Using Your Metrics Page
-
- Below is your homepage and the best place to visualize your Air Factors by device.
- You can always get back to this page by clicking on the “Awair” logo on the top left of any page on the dashboard.
- While viewing specific devices or time ranges, it is easy to share your current view with a colleague. Copy the full URL in your browser window and send to someone else who has access to the same Dashboard Organization.
Exporting Your Data
-
- Click on the icon on the upper left hand corner to bring up the side menu.
- Click on “Export Data”. On the next screen, select the devices from which you would like data exported. You can check one or multiple devices at a time.
- At the bottom of the screen you will see two buttons “Timeframe” and “Air Factors.”
- Click “Timeframe” and select the time range for your dataset.
- Click “Air Factors” and select one, many, or all of the sensor factors to export.
- Click the blue “Export” button.
- You will see a .zip file exporting to your computer’s downloads location. Double click on the downloaded file and the folder it contains will have a
.csvfile for each device you selected. - Open the
.csvfile in your preferred spreadsheet application to view your dataset.
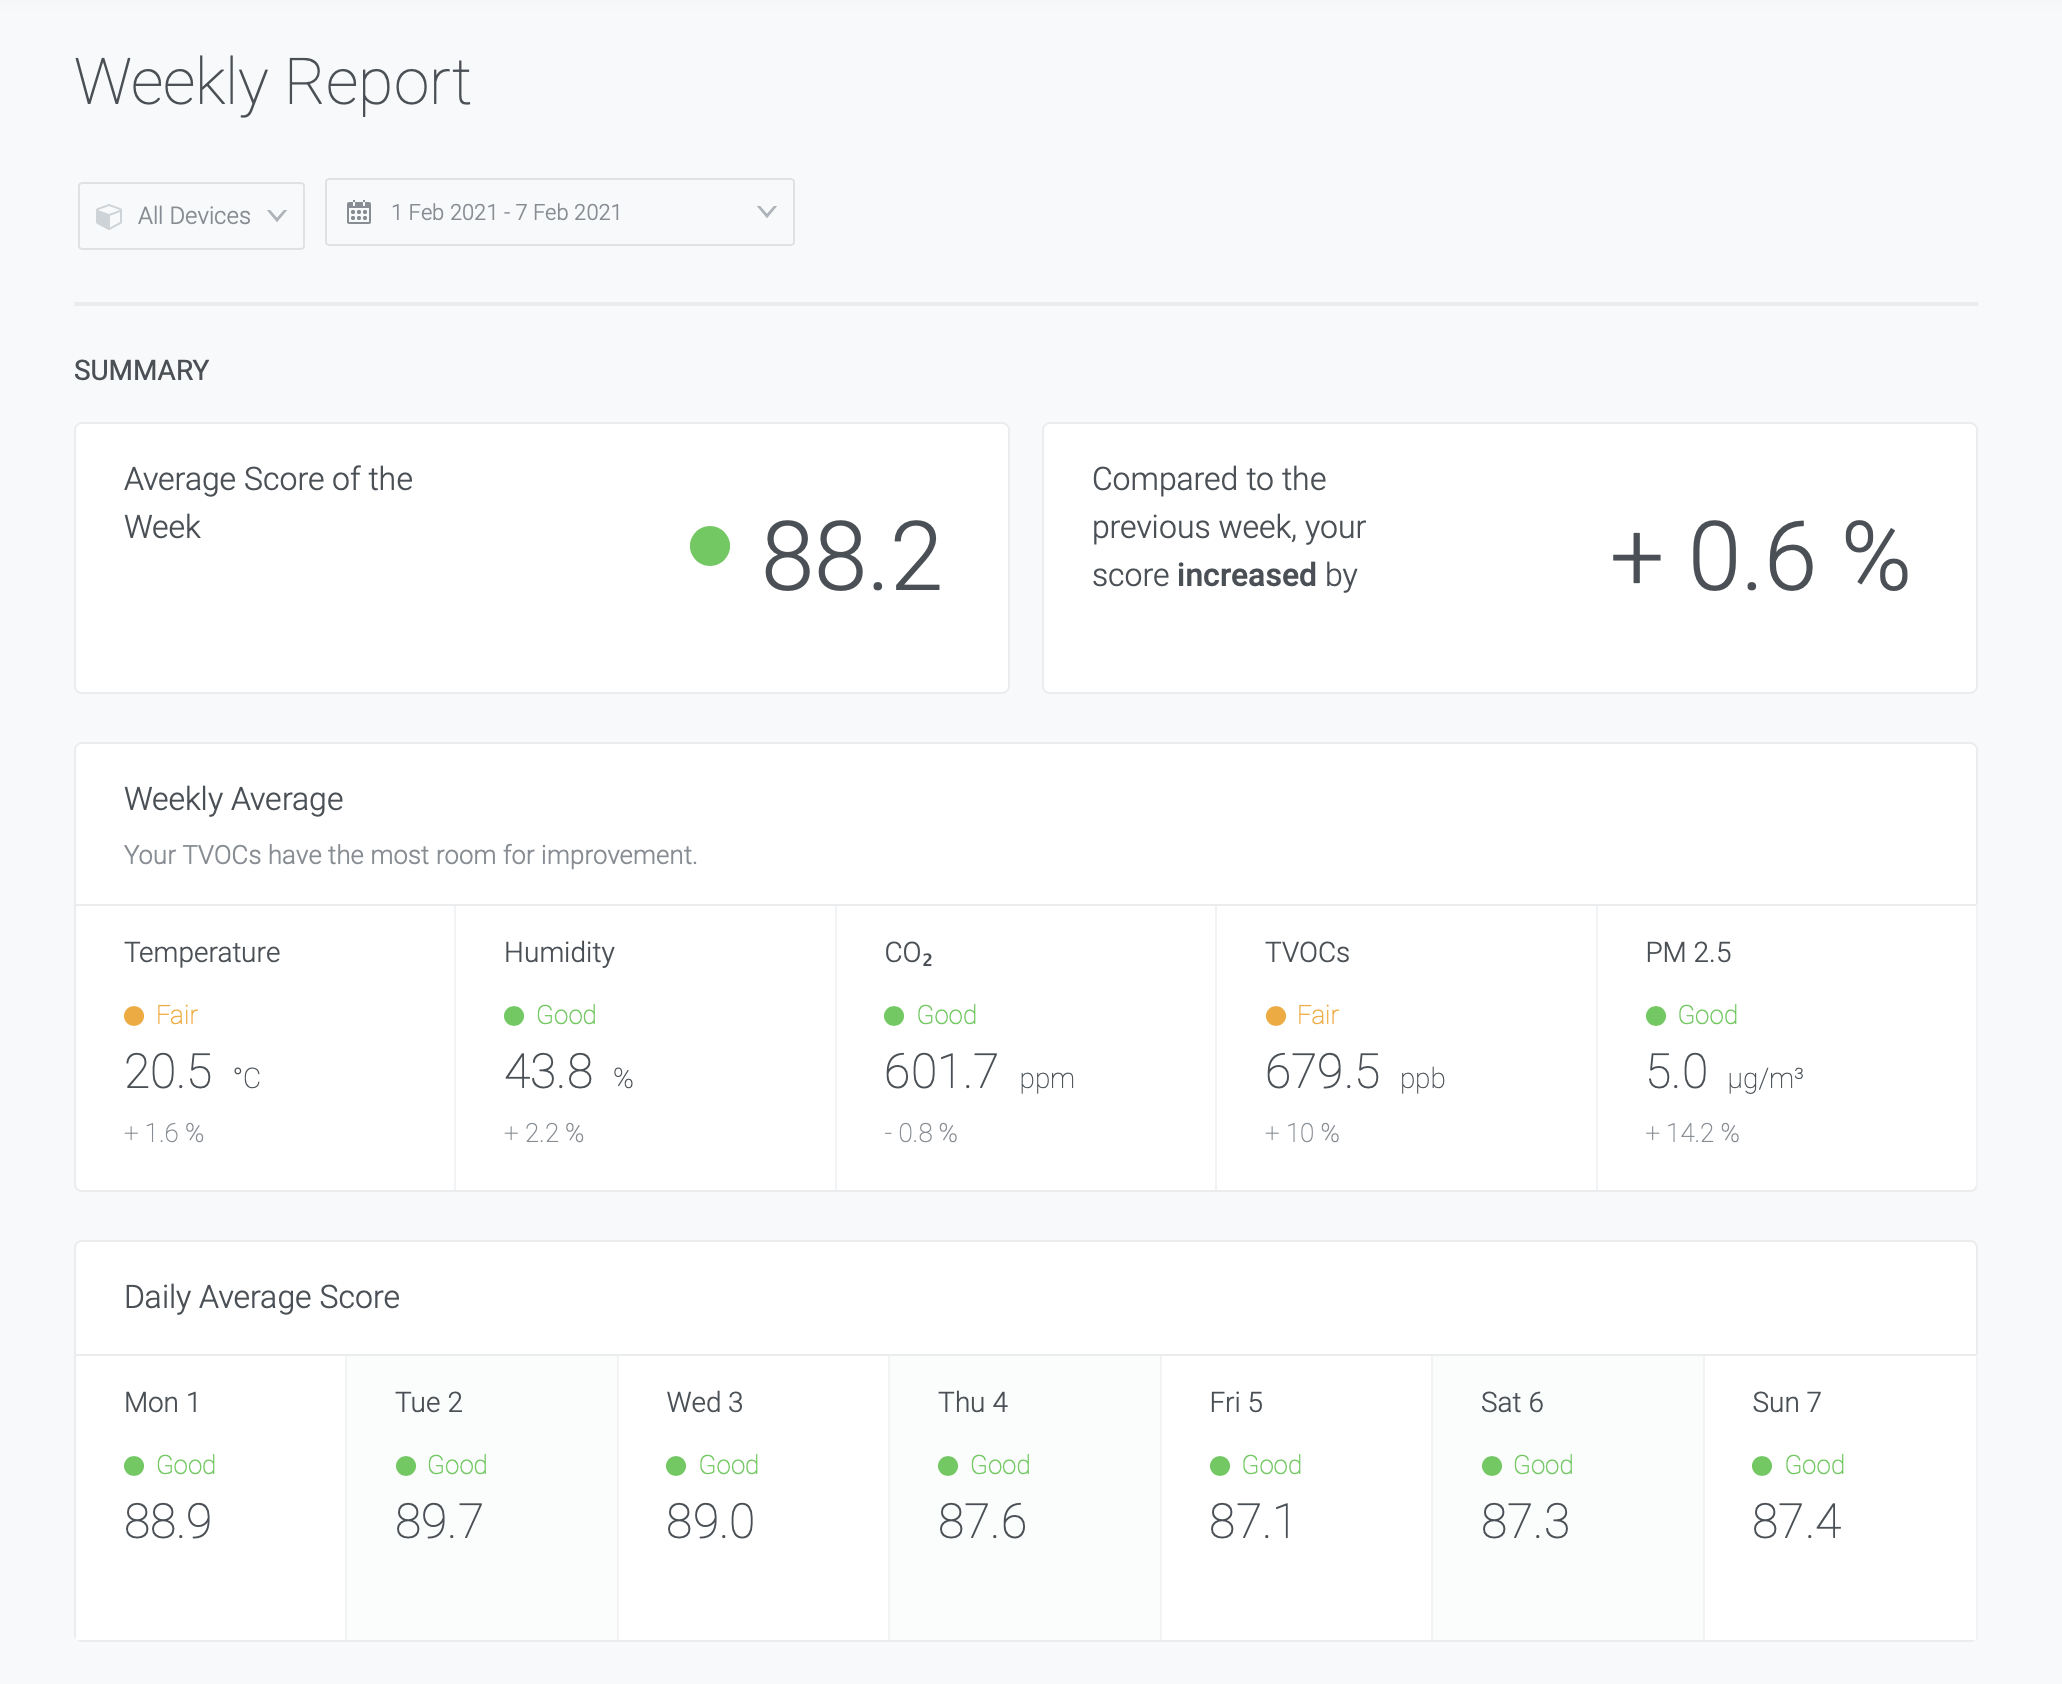
Viewing Your Weekly Reports
-
-
Click on the icon on the upper left hand corner to bring up the side menu.
-
Click on “Weekly Report”. On the next screen, you will see the average summary for all of your devices.
-
To view the summary by location or to change the date range, select from the dropdowns underneath the “Weekly Report” header on the page.
-